
Set alert rules and Telegram notifications to Grafana (v1.0)
Tested on Ubutnu 20.04, Grafana 7.4.3, Pormetheus 2.15.2
Prerequisites- Grafana installed and running
- Prometheus installed and running
- Telegram account
Set Telegram notifications
- First of all, you must create a new Telegram bot with BotFather. Click on this link https://t.me/botfather
Insert command line /newbot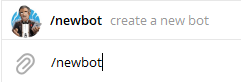
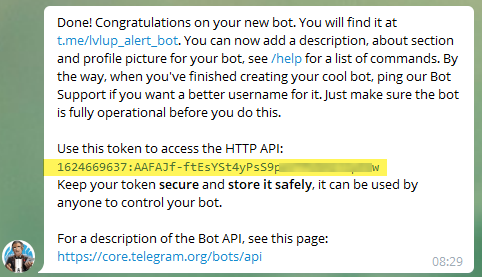
Choose a full name for your bot.
Choose a user name for your bot, the name must end with _bot
Copy your BOT API Token.
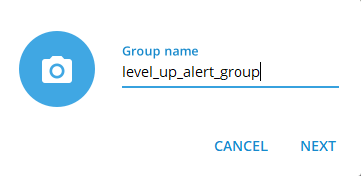
- Create a new Telegram group. This group will receive notifications.
Add your new bot to the group.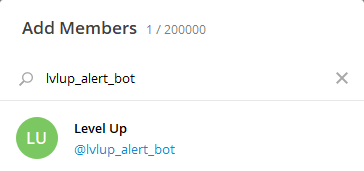
- Add your BOT API Token to this link https://api.telegram.org/bot< YOUR BOT API TOKEN >/getUpdates
Get your Telegram group ID.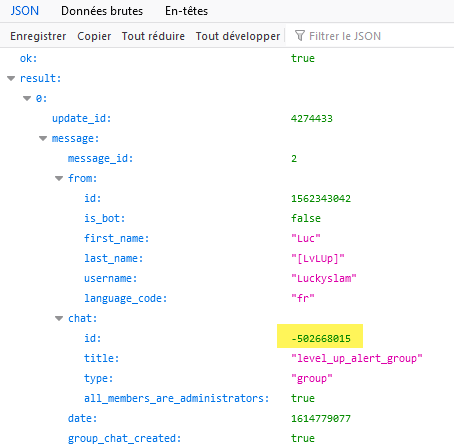
- On your Grafana instance, create a new notification channel.

Click on New channel
- Add a channel name, choose type Telegram and add your BOT API Token and your Group ID.
Before saving, test your new channel.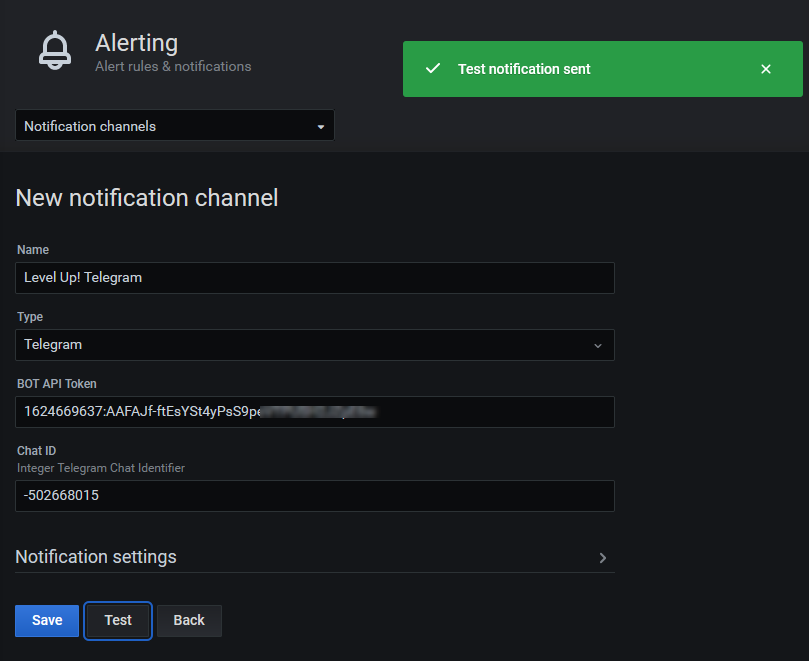
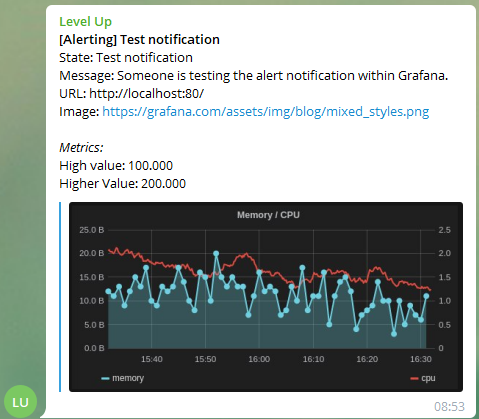
- Check notification test on Telegram group.
- You can now add an Alert rule to a panel.
Alert rules are not available for all types of panels, panel with query like node_load can.
- Set condition to 90% and add your Telegram notification channel. On this panel, notifications will be sent every time CPU load goes above 90%.
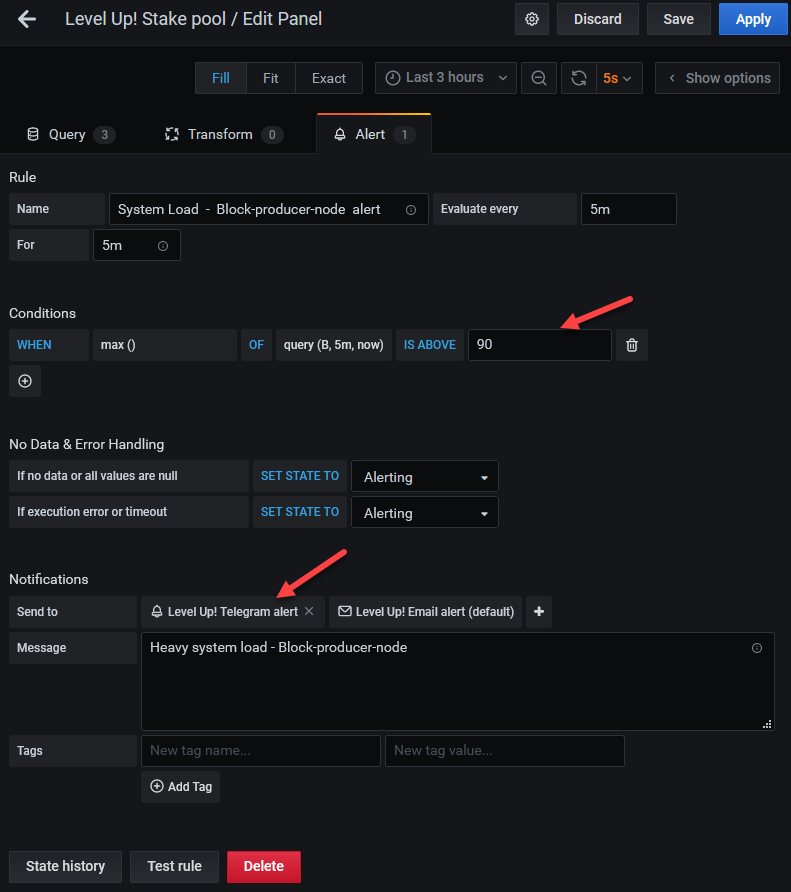
Click on Save button. - When you see a green heart, that means your alert rule conditions are met. If not, you will receive Telegram and Email notification and you will see a broken red heart.


You can add the plugin Grafana-image-render if you want to see a nice graph in notifications.
sudo grafana-cli plugins install grafana-image-rendererIf you want to know more about alert rules, you can browse the official Grafana documentation.


